How Inflation Is Measured
Inflation is one of the most widely used terms in economic and financial reporting. It is often described as the rate at which prices are rising, but the way it is measured is more structured than that simple definition might suggest.
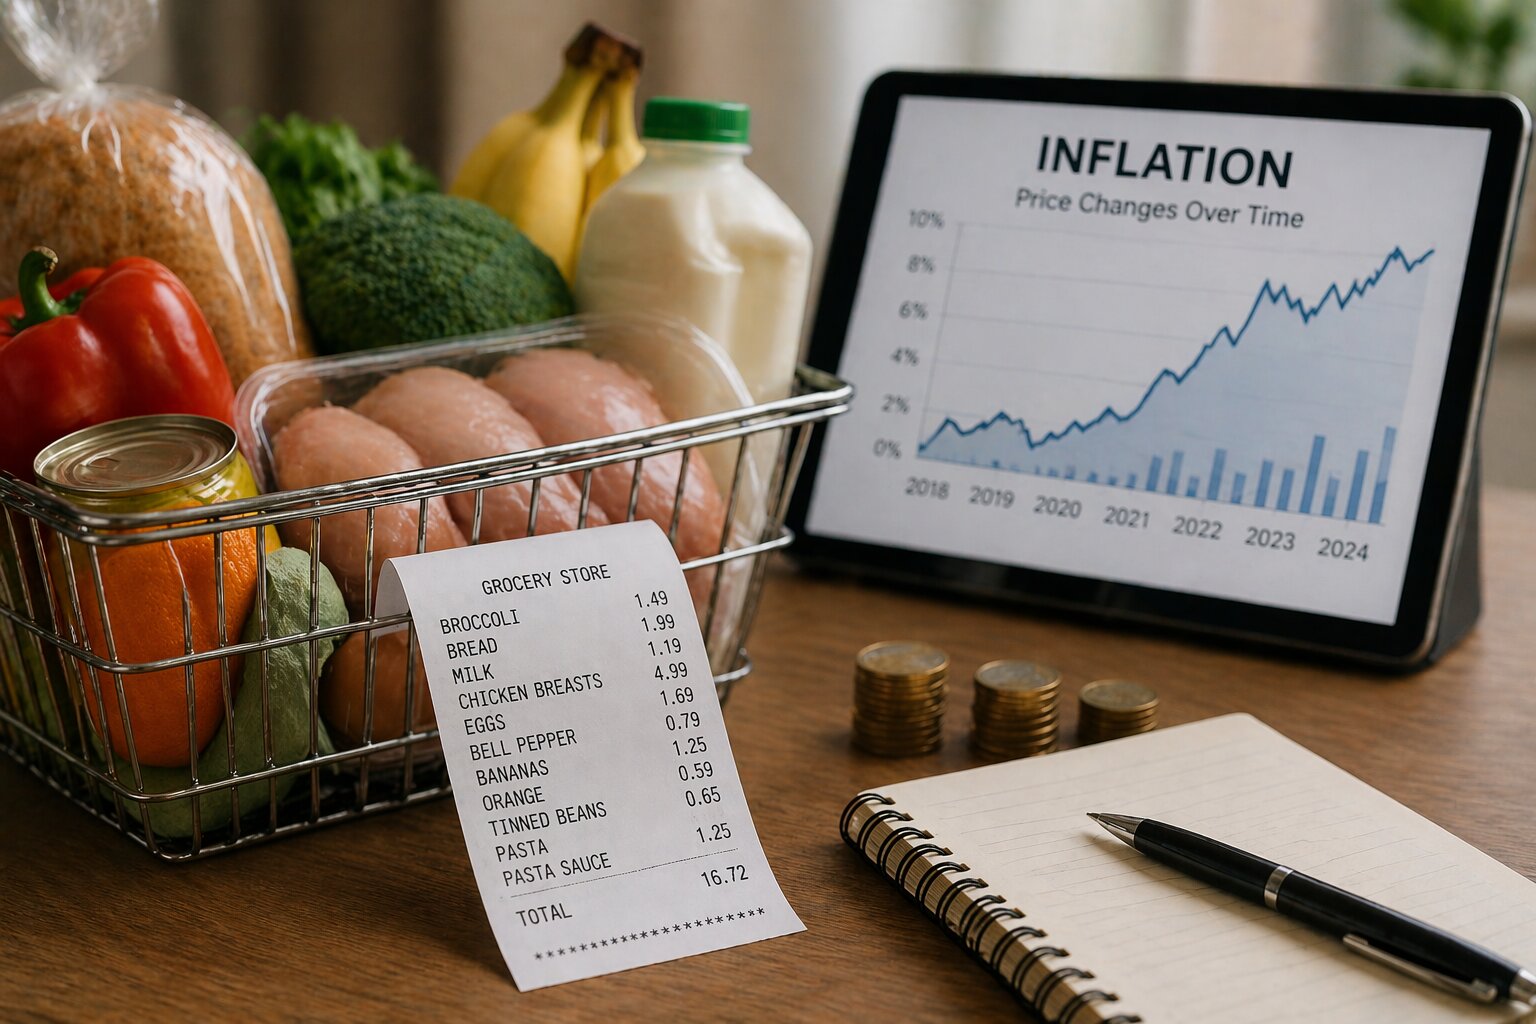
In broad terms, inflation is measured by tracking changes in the prices of goods and services over time. Rather than looking at a single item in isolation, statistical agencies compile baskets of products and services intended to reflect a broad picture of spending in the economy. These baskets are then used to observe how prices move from one period to the next.
This basket approach matters because inflation is not about the price of one thing rising or falling on its own. Individual prices can change for all kinds of reasons, including seasonality, supply issues, tax changes or shifts in demand. Inflation measures aim instead to capture a wider pattern across many categories of spending.
The contents of a basket are typically designed to represent everyday consumer spending in broad terms. They may include food, energy, transport, housing-related costs, clothing, communications, leisure items and services. The exact mix changes over time as spending habits evolve and as statistical methods are reviewed.
Weighting is a key part of the process. Not every category is treated as equally important. Items that make up a larger share of household or consumer spending tend to carry more weight in the overall measure. This is intended to make the final figure more representative of wider spending patterns rather than of isolated price movements.
Different inflation measures may exist for different purposes. Some focus on consumer prices more broadly, while others may place different emphasis on housing or sector-specific costs. As a result, reporting sometimes refers to more than one inflation indicator. These measures are related, but they are not always identical in scope or methodology.
The reason inflation data attracts so much attention is that it affects the interpretation of the wider economy. Rising inflation may suggest strong demand, supply disruption, cost pressures or a combination of factors. Slowing inflation may be interpreted differently depending on the economic context. In either case, the data is watched closely because it feeds into discussion about interest rates, wages, business costs and household finances.
Inflation measurement is also about comparison over time. The headline number is usually expressed as a percentage, indicating how much prices have changed compared with an earlier period. Monthly and annual comparisons are both common in reporting, and each can tell a slightly different story. A monthly change may show short-term movement, while an annual figure may give a broader sense of direction.
It is also possible for the overall inflation rate to move even when some prices are falling. This is because the measure reflects the combined effect of many categories rather than the direction of every single item. Some parts of the basket may rise quickly, others slowly, and others may decline. The final result is an aggregate picture.
For businesses, inflation data matters because it shapes the wider cost environment. Input prices, wage expectations, consumer demand and pricing conditions can all be discussed in relation to inflation trends. For households, inflation is often reported in connection with living costs, spending power and the broader economic outlook.
The publication of inflation figures is therefore more than a statistical update. It is a major reference point for economists, policymakers, businesses, financial institutions and the media. The data may influence debate about central bank decisions, public policy and economic momentum, which is why it appears so frequently in both business and personal finance coverage.
Understanding how inflation is measured helps make those headlines easier to interpret. The reported figure is not simply a rough estimate or a reflection of one shopping trip. It is the result of a structured attempt to track changing prices across a broad and weighted basket of goods and services over time.
That is why inflation remains such a central part of economic reporting. It offers a way of summarising how prices are changing across the economy and provides a common reference point for understanding the wider financial and commercial environment.
This article is for general information only and does not constitute financial or professional advice.